My demo @ #ISR, #UCI... ics.uci.edu/~vpalepu/site/… went live this morning ... Go explore a program execution :)
— Vijay Krishna (@vkrishnapalepu) May 31, 2013
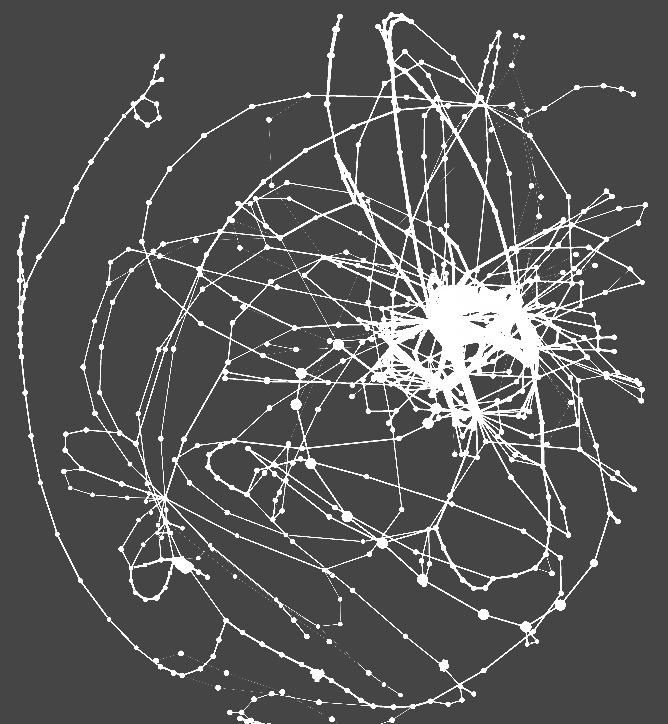
This is a very early prototype to assist developers, supported with visualization, to explore a program execution. This for instance would allow a developer to identify sections of the code that were executed right before a failure occurred because chances are that the fault is likely to be present in those sections (it might not be the try-catch block where the exception occurred, but probably the code that got executed before the try-catch block, that led to the exception). This alleviates the burden of manually figuring out the execution sequence, for instance using a debugger. This prototype looks at a single recorded execution of NanoXML.
Each node in the visualization happens to be a source code line in the Java program, NanoXML. The layout of the source code, or the nodes, is guided by a force directed graph based on how the source code instructions are dependent on each other.
IMPORTANT Stay at the page for about 30-60 seconds for the visualization to load completely. The loading process currently suspends itself if you move away to another tab in your browser.
All Feedback is appreciated! Send your feedback to vpalepu @ uci . edu
Also, thank you HTML5 and D3.js for killing the learning curve with developing web-applications! This was a 12-hour hack for a HTML5 newbie, which would not have been possible had the underlying technology not been so straight-forward!
Tags:
Related Posts
- 02 May 2020 » Santa Monica Views
- 26 Apr 2020 » California, USA
- 04 Nov 2019 » Fall And Fires


