


I am interested in building, visualizing and studying reusable models of the runtime behavior of software components that can be leveraged for a number of software development, maintenance, and testing tasks. My current focus, specifically, is to facilitate software debugging which is a complex and ubiquitous activity within software engineering.
My doctoral research looked at models for studying runtime behavior of software that often suffer from information overload given that even moderately sized software programs, which typically range from 10–100KLOC, often encompass millions of runtime actions that need to be accounted for. My work looks at solutions that facilitate analysis and comprehension of software executions in ways that combat information overload by (a) abstracting or summarizing program behavior and (b) globally visualizing program executions.
Following are brief descriptions of the projects I have worked on.
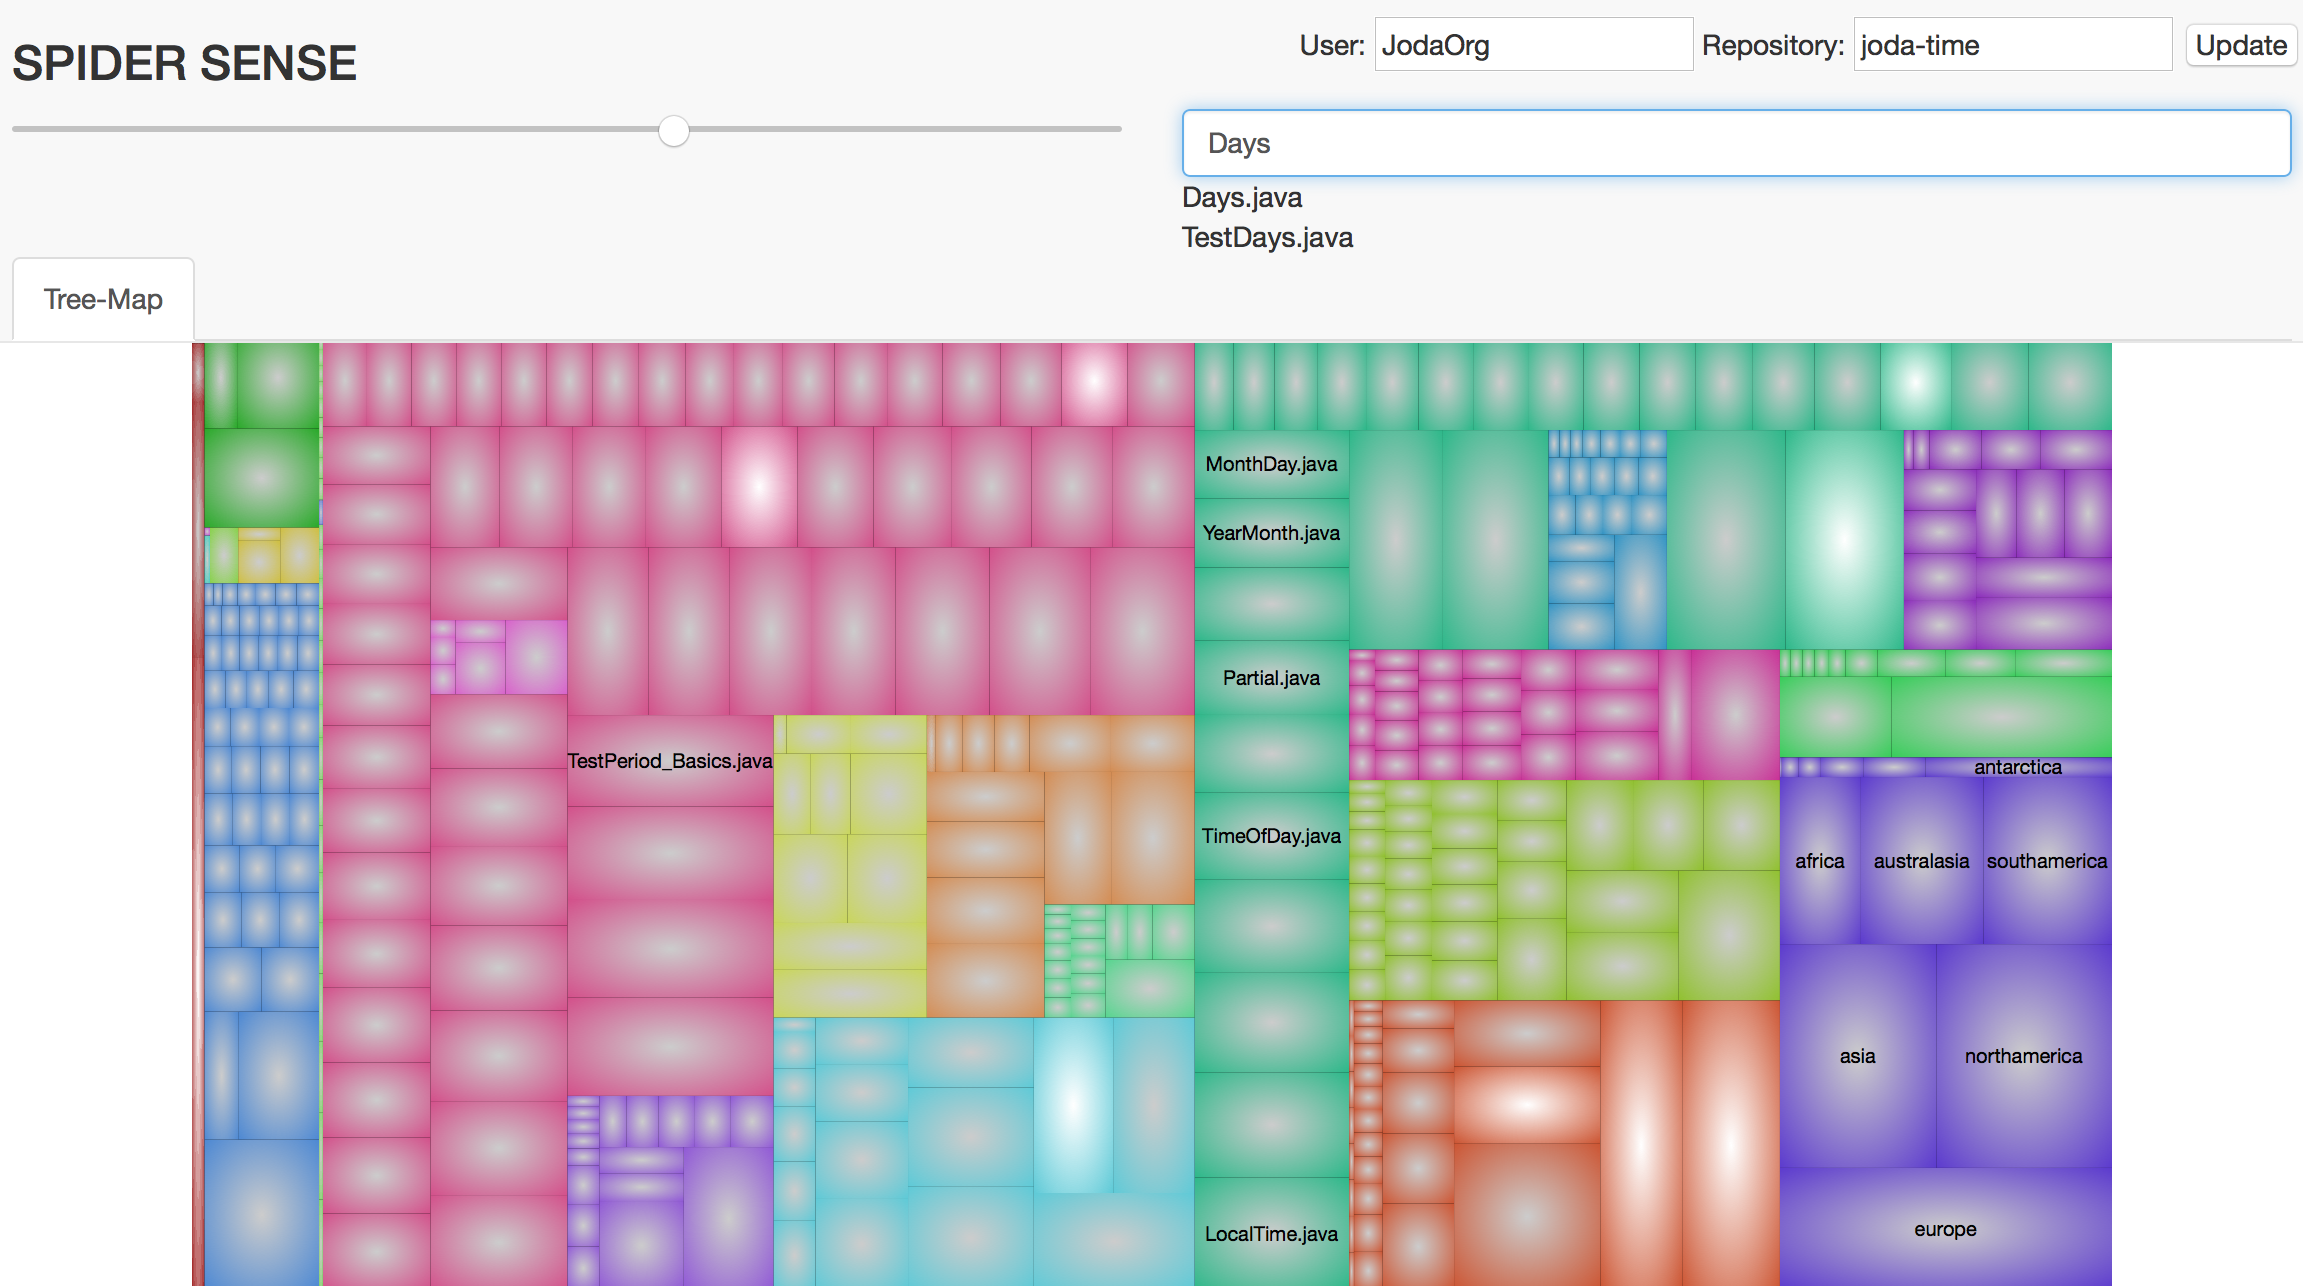 Today, many of the research innovations in software visualization and comprehension are evaluated on small-scale programs in a way that avoids actual human evaluation, despite the fact that these techniques are designed to help programmers develop and understand large and complex software. The investments required to perform such human studies often outweigh the need to publish. As such, the goal of this work (and toolkit) is to enable the evaluation of software visualizations of real-life software systems by its actual developers, as well as to understand the factors that influence adoption. The approach is to directly assist practicing software developers with visualizations through open and online collaboration tools. The mechanism by which we accomplish this goal is an online service that is linked through the projects' revision-control and build systems. We are calling this system Spider SENSE, and it includes web-based visualizations for software exploration that is supported by tools for mirroring development activities, automatic building and testing, and automatic instrumentation to gather dynamic-analysis data. In the future, we envision the system and toolkit to become a framework on which further visualizations and analyses are developed. Spider SENSE is open-source and publicly available for download and collaborative development.
Reddy, Nishaanth H.; Kim, Junghun; Palepu, Vijay Krishna and Jones, James, "Spider SENSE: Software-Engineering, Networked, System Evaluation," , 2015 3rd IEEE Working Conference on Software Visualization (VISSOFT), pp.1-5, 27-28 September 2015. [paper] [website]
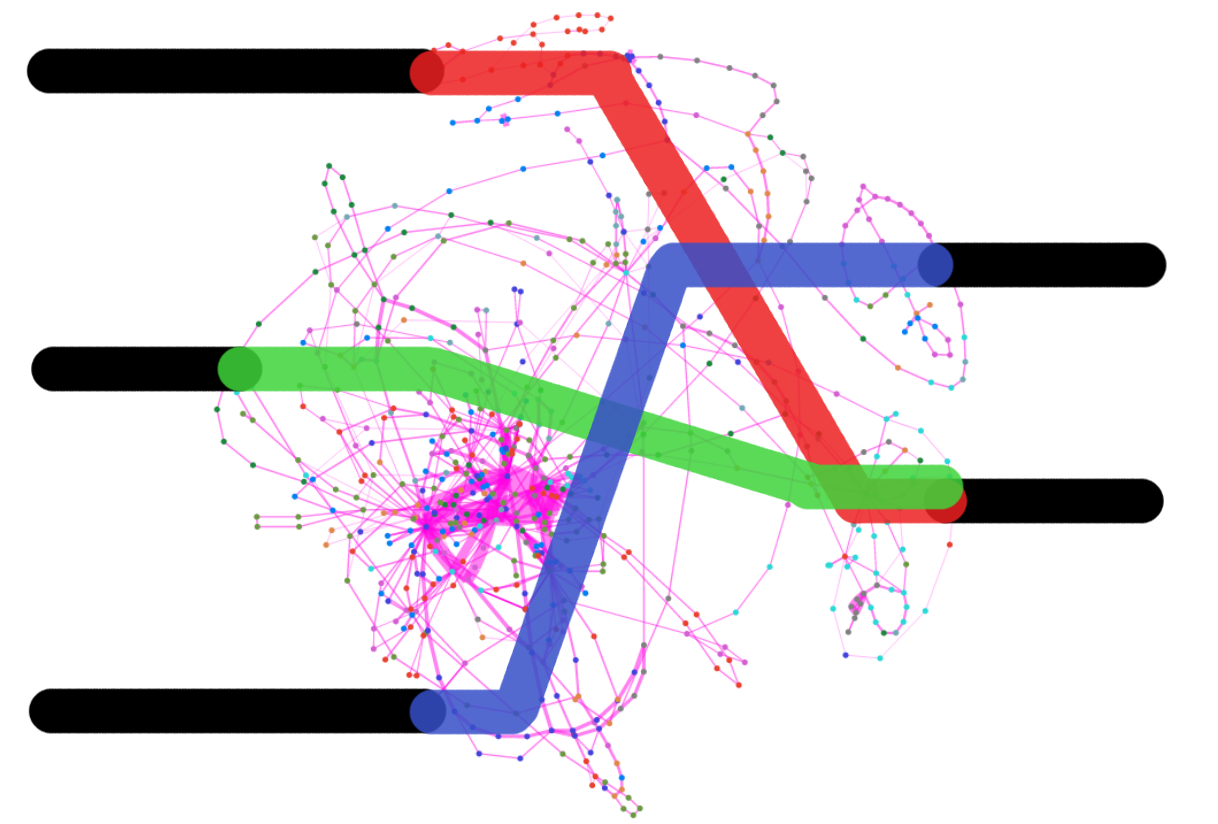
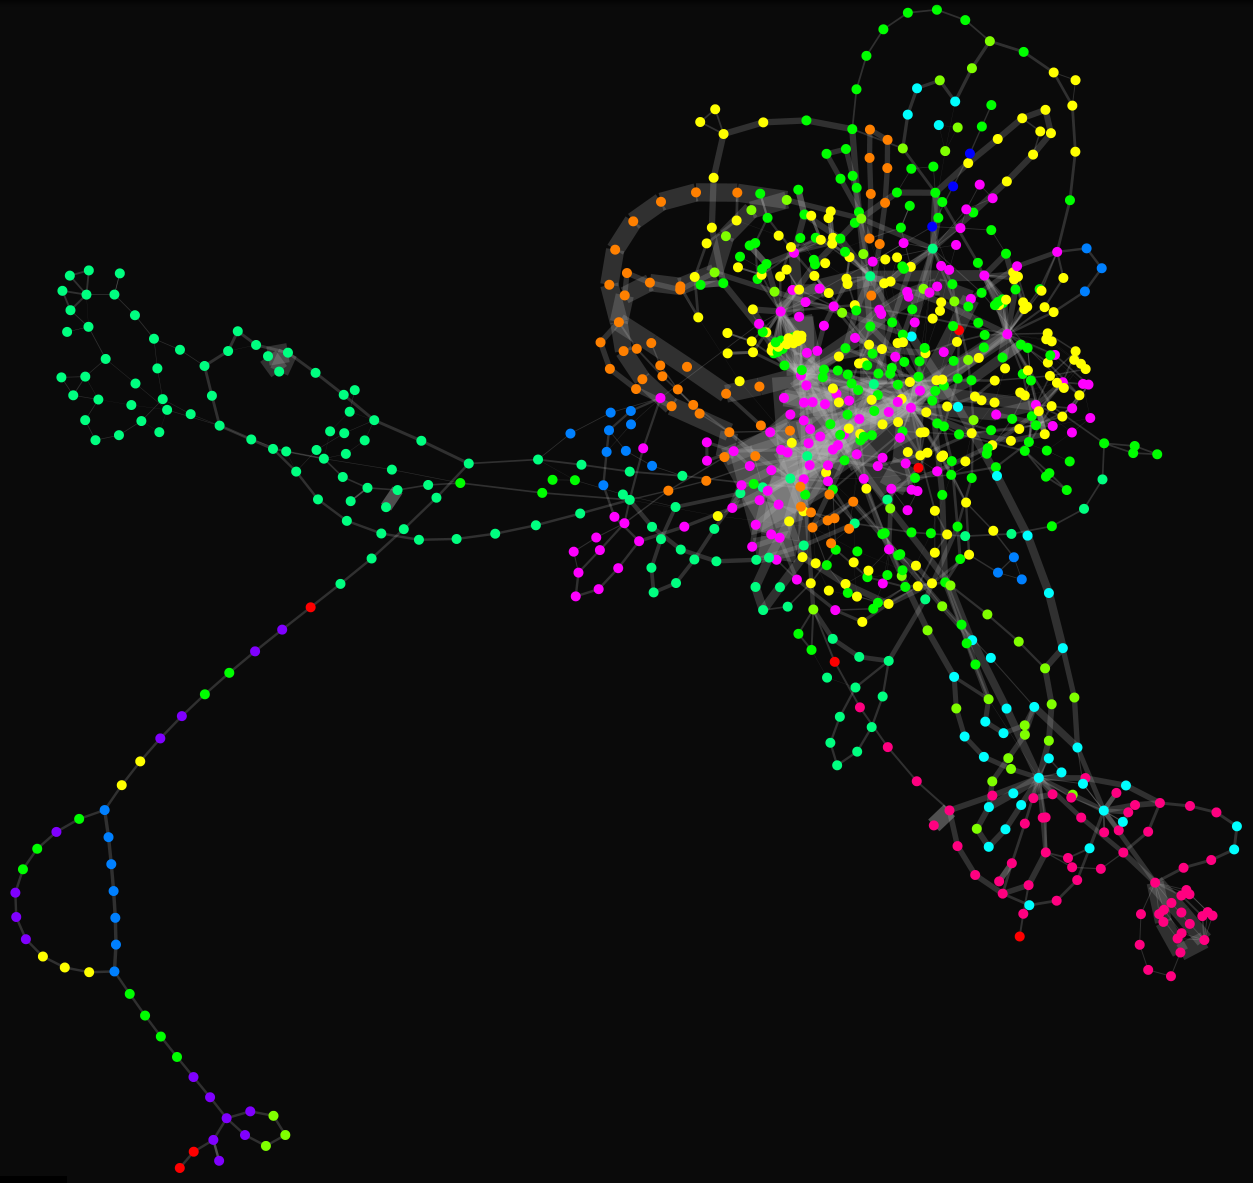 Software engineers organize source code into a dominant hierarchy of components and modules that may emphasize various characteristics over runtime behavior. In this way, runtime features may involve cross-cutting aspects of code from multiple components, and some of these features may be emergent in nature, rather than designed. Although source-code modularization assists software engineers to organize and find components, identifying such cross-cutting feature sets can be more difficult. This work presents a visualization that includes a static (i.e., compile-time) representation of source code that gives prominence to clusters of cooperating source-code instructions to identify dynamic (i.e., runtime) features and constituent behaviors within executions of the software. In addition, the visualization animates software executions to reveal which feature clusters are executed and in what order. The result has revealed the principal behaviors of software executions, and those behaviors were revealed to be (in some cases) cohesive, modular source-code structures and (in other cases) cross-cutting, emergent behaviors that involve multiple modules. In this paper, we describe our system (Cerebro), envisage the uses to which it can be put, and evaluate its ability to reveal emergent runtime features and internal constituent behaviors of execution. We found that: (1) the visualization revealed emergent and commonly occuring functionalities that cross-cut the structural decomposition of the system; (2) four independent judges generally agreed in their interpretations of the code clusters, especially when informed only by our visualization; and (3) interacting with the external interface of an application while simultaneously observing the internal execution facilitated localization of code that implements the features and functionality evoked externally.
Palepu, Vijay Krishna and Jones, James, "Revealing Runtime Features and Constituent Behaviors within Software," , 2015 3rd IEEE Working Conference on Software Visualization (VISSOFT), pp.1-10, 27-28 September 2015. [paper] [website]
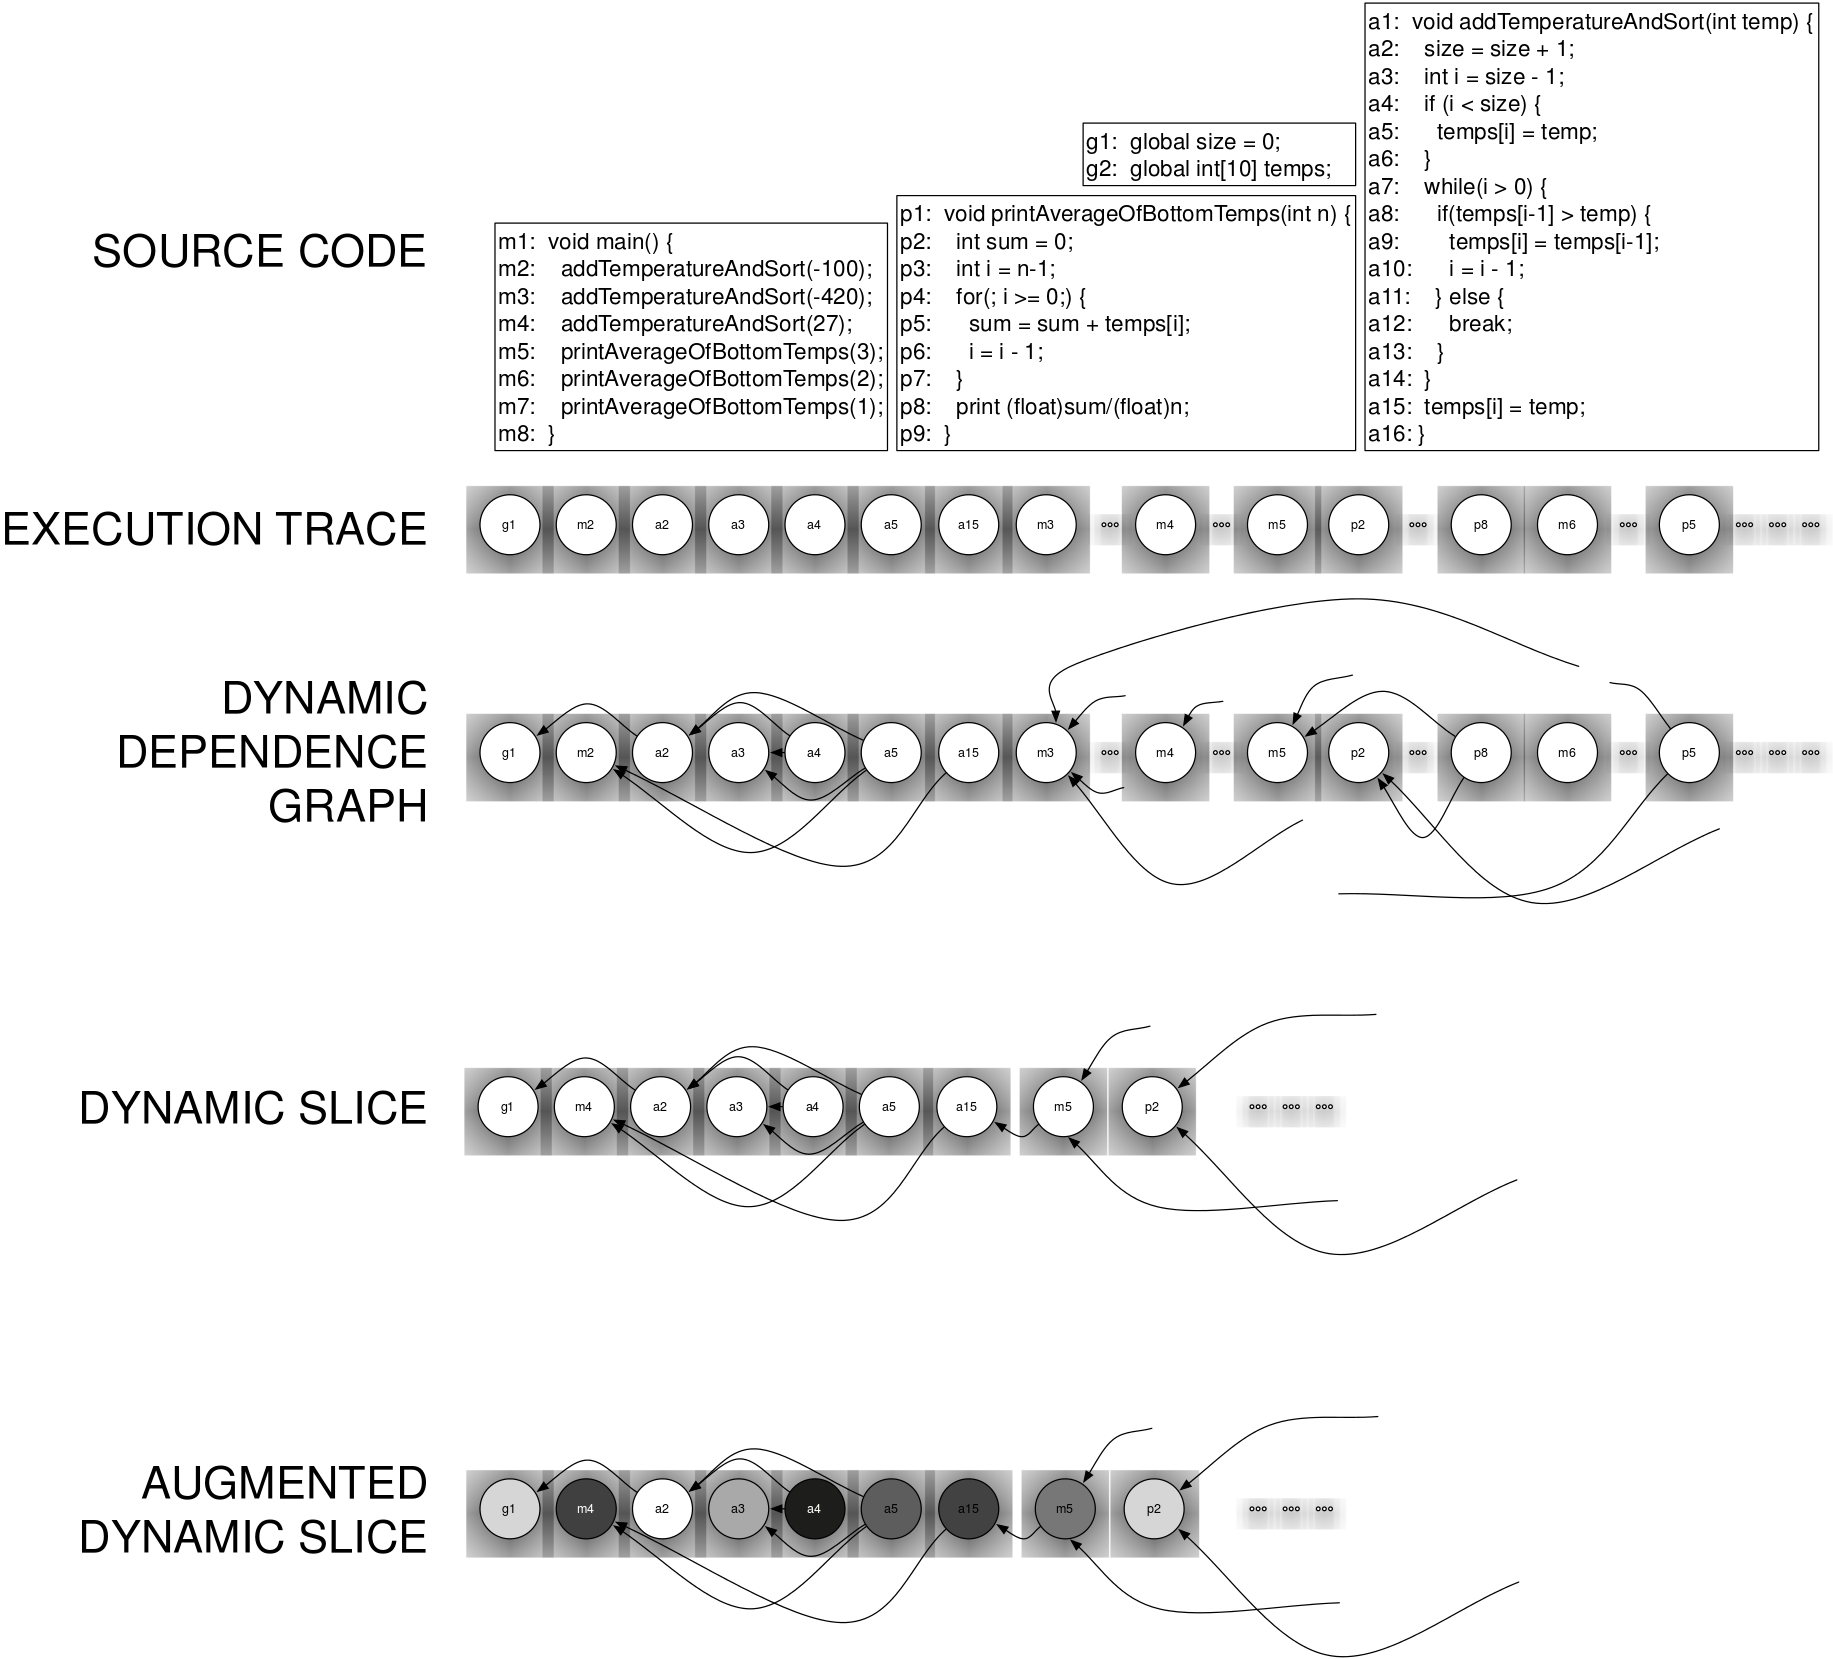 Dynamic slicing is an analysis that operates on program execution models (e.g., dynamic dependence graphs) to sup- port the interpreation of program-execution traces. Given an execution event of interest (i.e., the slicing criterion), it solves for all instruction-execution events that either affect or are affected by that slicing criterion, and thereby reduces the search space to find influences within execution traces. Unfortunately, the resulting dynamic slices are still often prohibitively large for many uses. Despite this reduction search space, the dynamic slices are often still prohibitively large for many uses, and moreover, are provided without guidance of which and to what degree those influences are exerted. In this work, we present a novel approach to quan- tify the relevance of each instruction-execution event within a dynamic slice by its degree of relative influence on the slicing criterion. As such, we augment the dynamic slice with dynamic-relevance measures for each event in the slice, which can be used to guide and prioritize inspection of the events in the slice.
Palepu, Vijay Krishna and Jones, James, "Discriminating Influences among Instructions in a Dynamic Slice," , 2014 29th IEEE/ACM International Conference on Automated Software Engineering (ASE), to appear, 15-19 September 2014. [paper] [slides]
 Modern applications make heavy use of third-party libraries and components, which poses new challenges for efficient dynamic analysis. To perform such analyses, transitive dependent components at all layers of the call stack must be monitored and analyzed, and as such may be prohibitively expensive for systems with large libraries and components. As an approach to address such expenses, we record, summarize, and reuse dynamic dataflows between inputs and outputs of components, based on dynamic control and data traces. These summarized dataflows are computed at a fine-grained instruction level; the result of which, we call “dynamic dependence summaries.” Although static summaries have been proposed, to the best of our knowledge, this work presents the first technique for dynamic dependence summaries. The benefits to efficiency of such summarization may be afforded with losses of accuracy. As such, we evaluate the degree of accuracy loss and the degree of efficiency gain when using dynamic dependence summaries of library methods. On five large programs from the DaCapo benchmark (for which no existing whole-program dynamic dependence analyses have been shown to scale) and 21 versions of NANOXML, the summarized dependence analysis provided 90% accuracy and a speed-up of 100% (i.e., ×2), on average, when compared to traditional exhaustive dynamic dependence analysis.
Palepu, Vijay Krishna; Xu, Guoqing and Jones, James, "Improving Efficiency of Dynamic Analysis with Dynamic Dependence Summaries," , 2013 28th IEEE International Conference on Automated Software Engineering (ASE), pp.59-69, 11-15 November 2013. [paper] [slides]
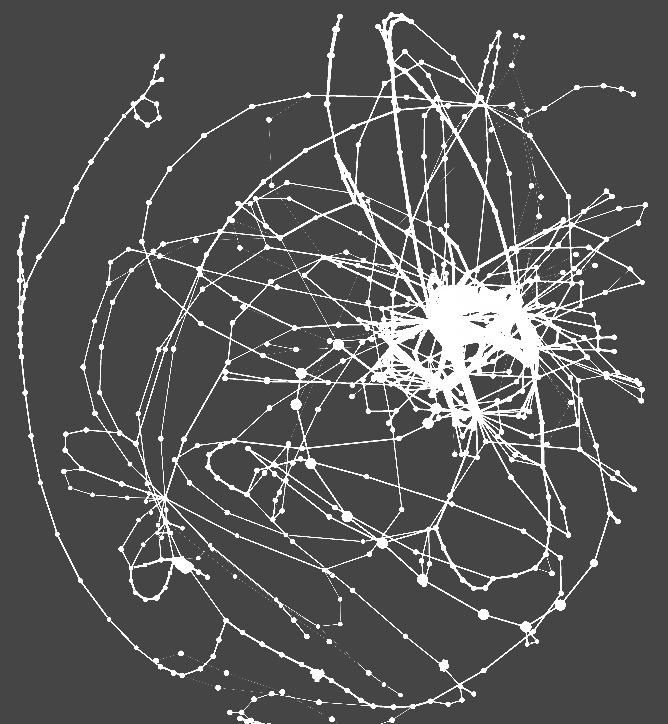
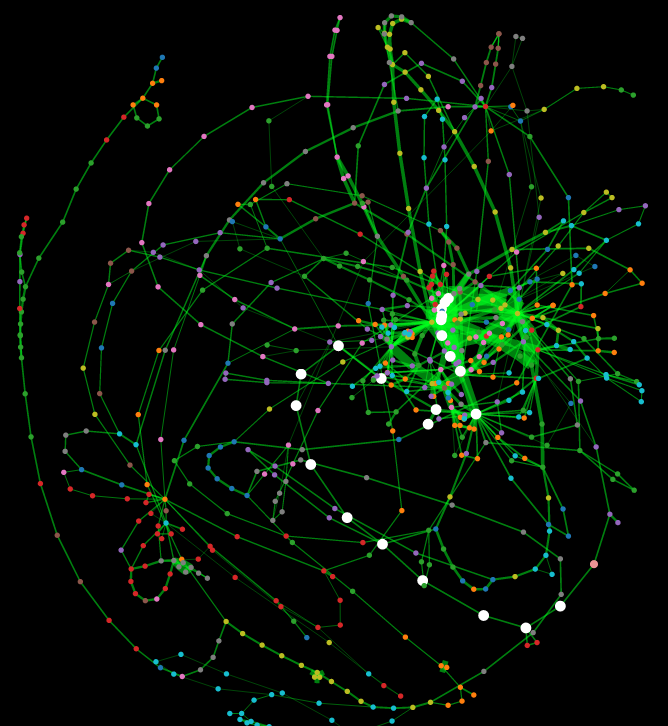 In this New Ideas and Emerging Results paper, we present a novel visualization, THE BRAIN, that reveals clusters of source code that co-execute to produce behavioral features of the program throughout and within executions. We created a clustered visualization of source-code that is informed by dynamic control flow of multiple executions; each cluster represents commonly interacting logic that composes software features. In addition, we render individual executions atop the clustered multiple-execution visualization as user-controlled animations to reveal characteristics of specific executions—these animations may provide exemplars for the clustered features and provide chronology for those behavioral features, or they may reveal anomalous behaviors that do not fit with the overall operational profile of most executions. Both the clustered multiple-execution view and the animated individual-execution view provide insights for the constituent behaviors within executions that compose behaviors of whole executions. Inspired by neural imaging of human brains of people who were subjected to various external stimuli, we designed and implemented THE BRAIN to reveal program activity during execution. The result has revealed the principal behaviors of execution, and those behaviors were revealed to be (in some cases) cohesive, modular source-code structures and (in other cases) cross-cutting, emergent behaviors that involve multiple modules. In this paper, we describe THE BRAIN and envisage the uses to which it can be put, and we provide two example usage scenarios to demonstrate its utility.
Palepu, Vijay Krishna and Jones, James, "Visualizing Constituent Behaviors within Executions," , 2013 1st IEEE International Working Conference on Software Visualization (VISSOFT), pp.1-4, 27-28 September 2013. [paper] [vimeo]
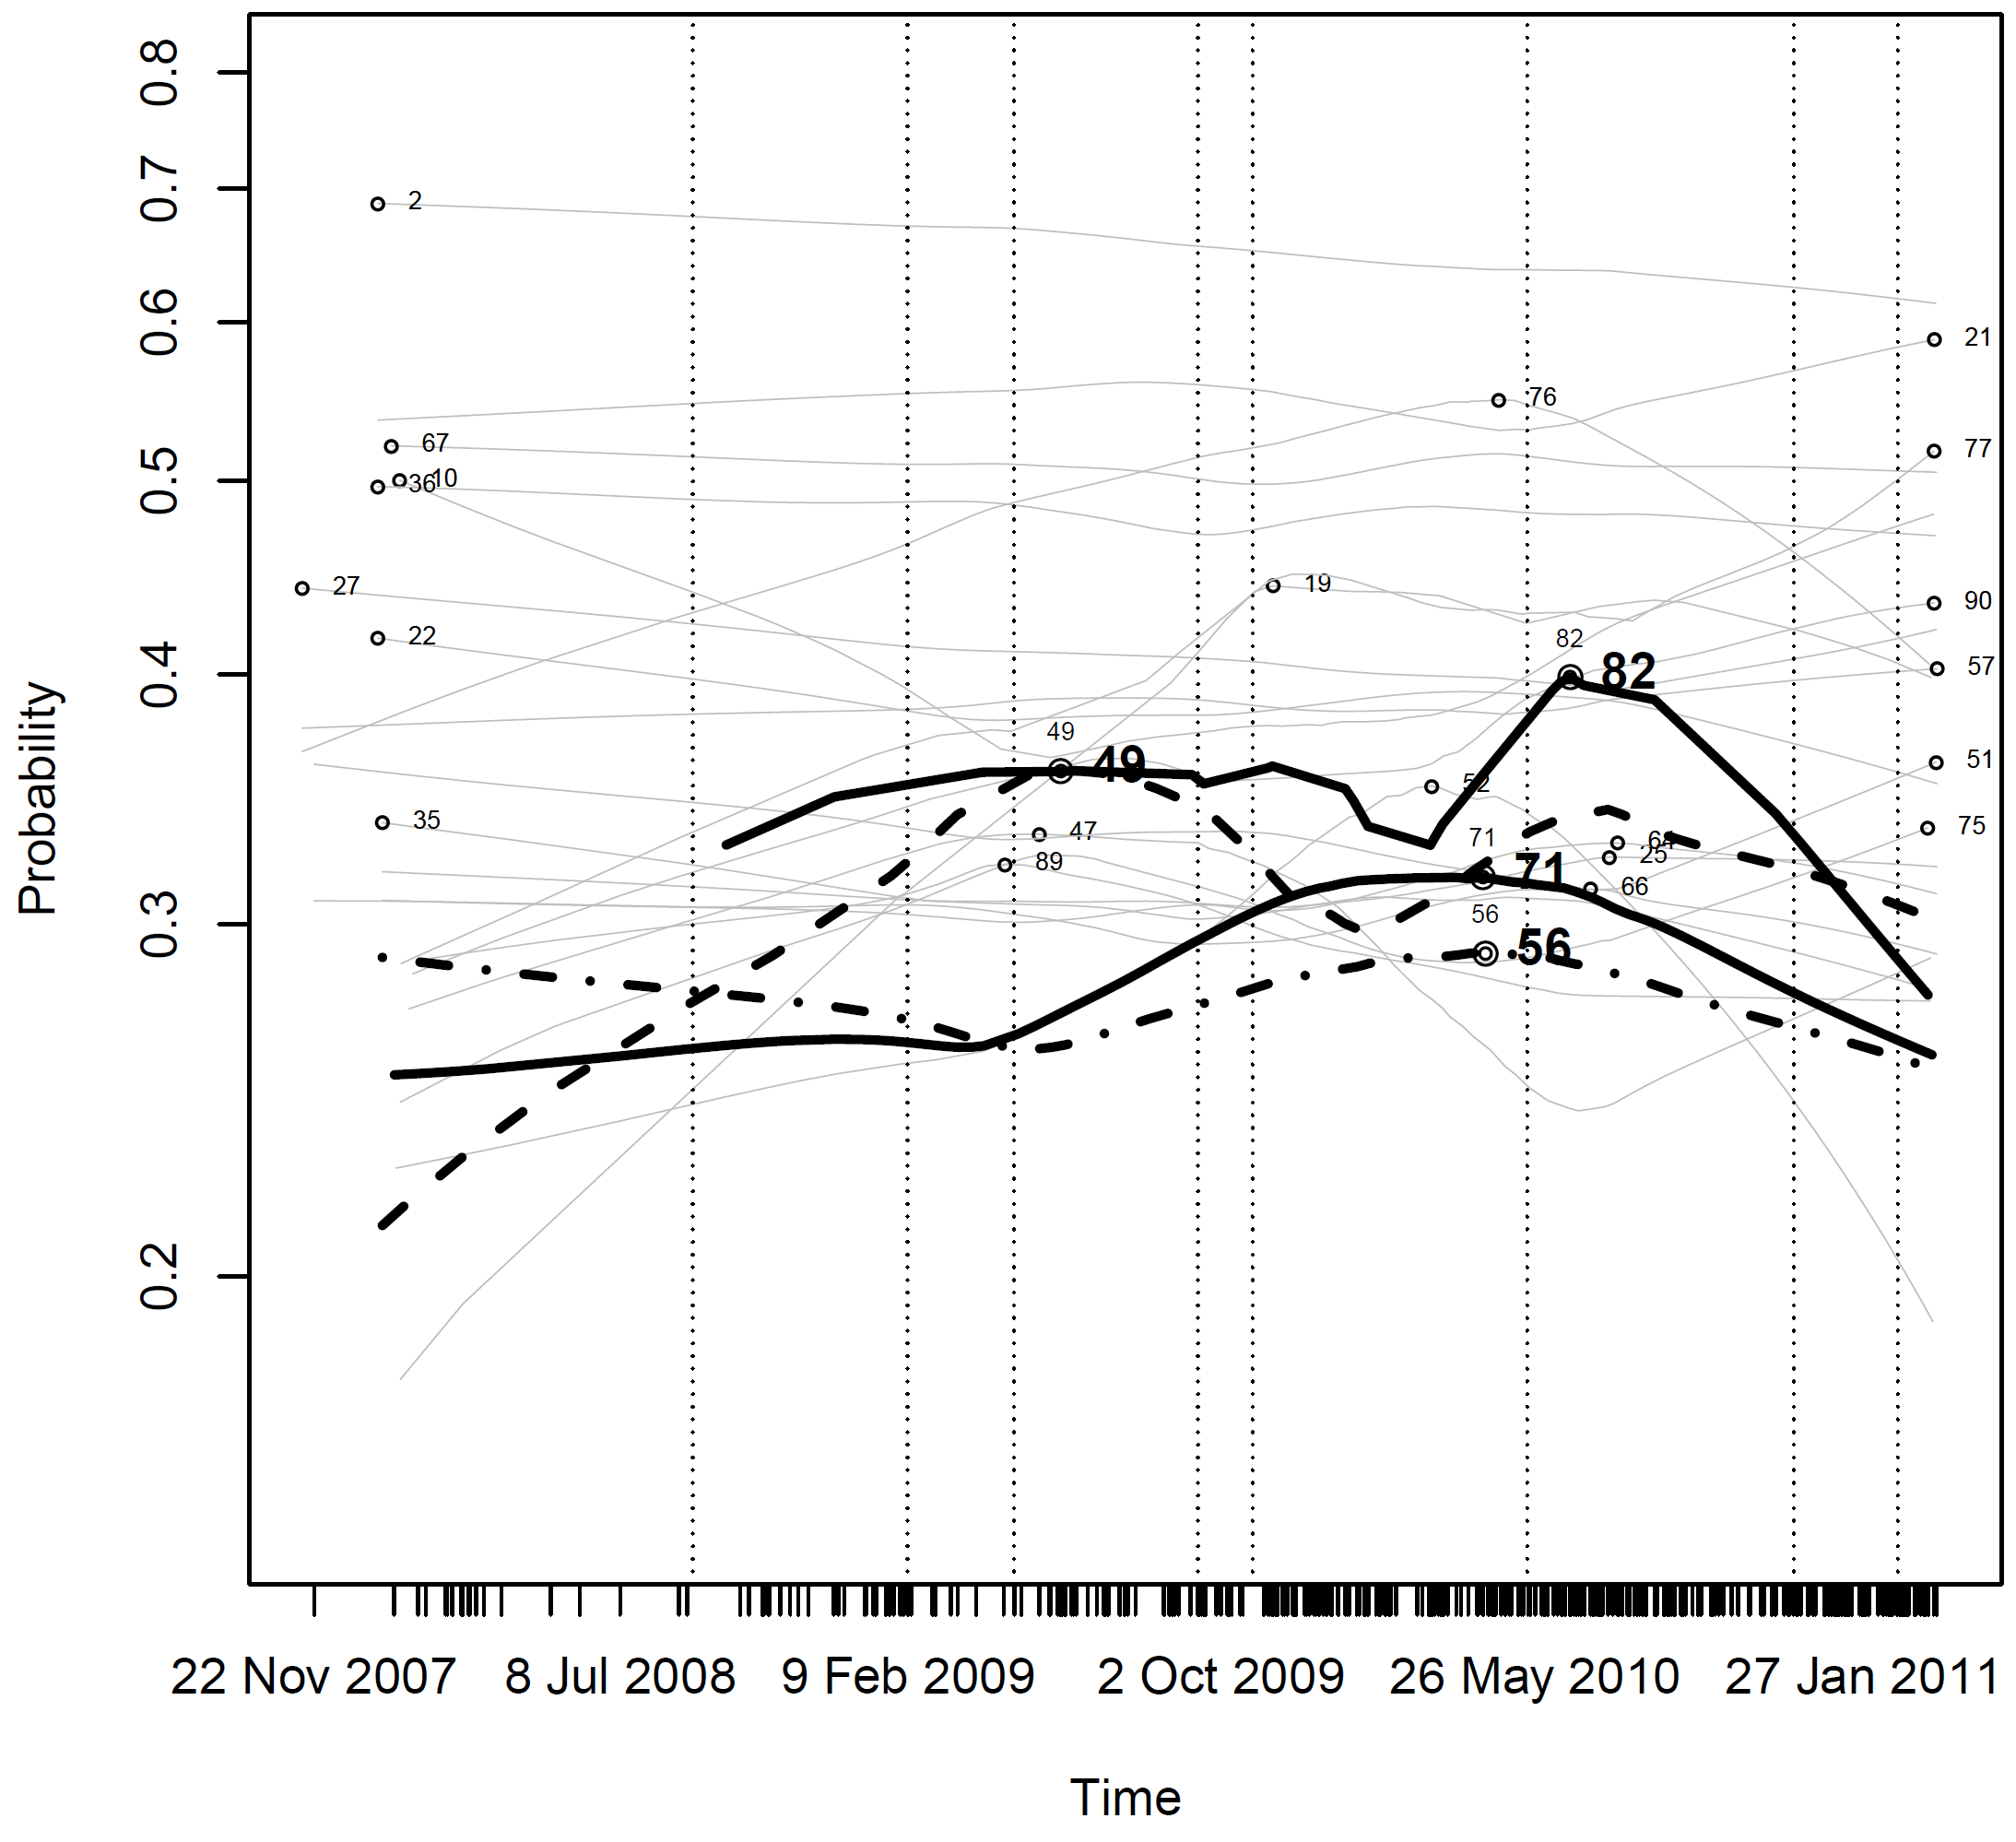 Studying vast volumes of bug and issue discussions can give an understanding of what the community has been most concerned about, however the magnitude of documents can overload the analyst. We present an approach to analyze the development of the Android open source project by observing trends in the bug discussions in the Android open source project public issue tracker. This informs us of the features or parts of the project that are more problematic at any given point of time. In turn, this can be used to aid resource allocation (such as time and man power) to parts or features. We support these ideas by presenting the results of issue topic distributions over time using statistical analysis of the bug descriptions and comments for the Android open source project. Furthermore, we show relationships between those time distributions and major development releases of the Android OS.
Martie, Lee; Palepu, Vijay Krishna; Sajnani, Hitesh and Lopes, Cristina, "Trendy bugs: Topic trends in the Android bug reports," , 2012 9th IEEE Working Conference on Mining Software Repositories (MSR), pp.120-123, 2-3 June 2012. [paper] [slides]